Pinterest Analytics has lots of different things to select and check, so it can be a little overwhelming sometimes. I get asked questions all the time about if impressions matter (spoiler alert: they don’t) or how much traffic an account should get each month, so if you’ve been wondering how to use Pinterest Analytics to track data for your business, this post is for you!
Metrics to select in Pinterest Analytics
If you’re just getting started with Pinterest, check out my other Pinterest blog posts to help you with your strategy! So first things for Pinterest Analytics, you need to make sure you have a business account and claim your website to have access to Pinterest Analytics.
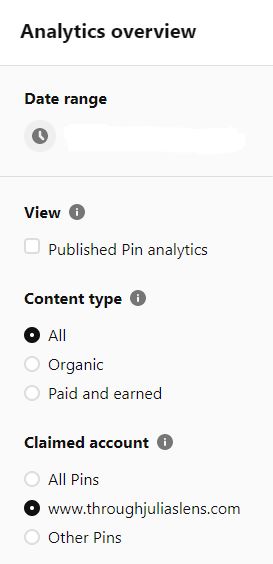
Once you have everything set up, on the left hand side in Pinterest Analytics, you’ll see a lot of different options to choose from. You can select the date range if there’s something specific you want to see, or if you’re just checking at the end of the month each month, you can just select the last 30 days.
Under Content Type, you can select from organic or paid or all pins. If you’re running any ads, you can select paid to see your data there, or if you just want to look at the pins that you’re organically pinning, select organic.
Claimed Account is important. The most valuable information from Pinterest is the data that’s connected to your own website, so you want to select your website url. All Pins is going to show you the data for all the pins you’ve pinned, including ones that are connected to other websites, and Other Pins is going to show you the information for pins not connected to your website.
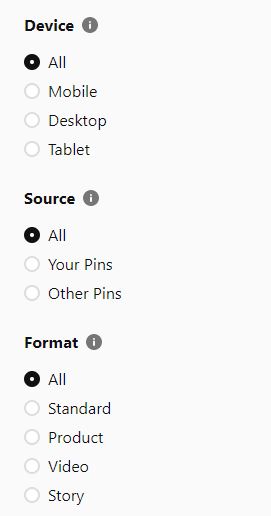
Under Device, you can choose the device that people are looking at your pins on if you want to see if more people are on their desktop or mobile, or you can just look at all your traffic.
Source lets you select pins that you’ve pinned or pins of yours that other people have pinned. This is helpful if you’re trying to get more engagement or you’re using Tailwind Communities and want to see if the pins that other people are sharing are actually getting traffic.
If you’ve been creating product, video, or story pins, you can sort them under Format. If you’re just creating standard photo pins, you can just select Standard or All.
For this account, I just create standard pins and don’t run ads, so I usually just check keep the metrics that Pinterest has automatically (while selecting my claimed website) but you can play around with them to compare different data.
Performance data to check
So now that you have your metrics selected, check the graph in the middle of the screen. There will be a dropdown menu under Performance Over Time where you can sort even more data, and I recommend choosing ones related to engagement, such as Outbound Clicks (formerly Link Clicks), Saves, Link Click Rate, or Save Rate.
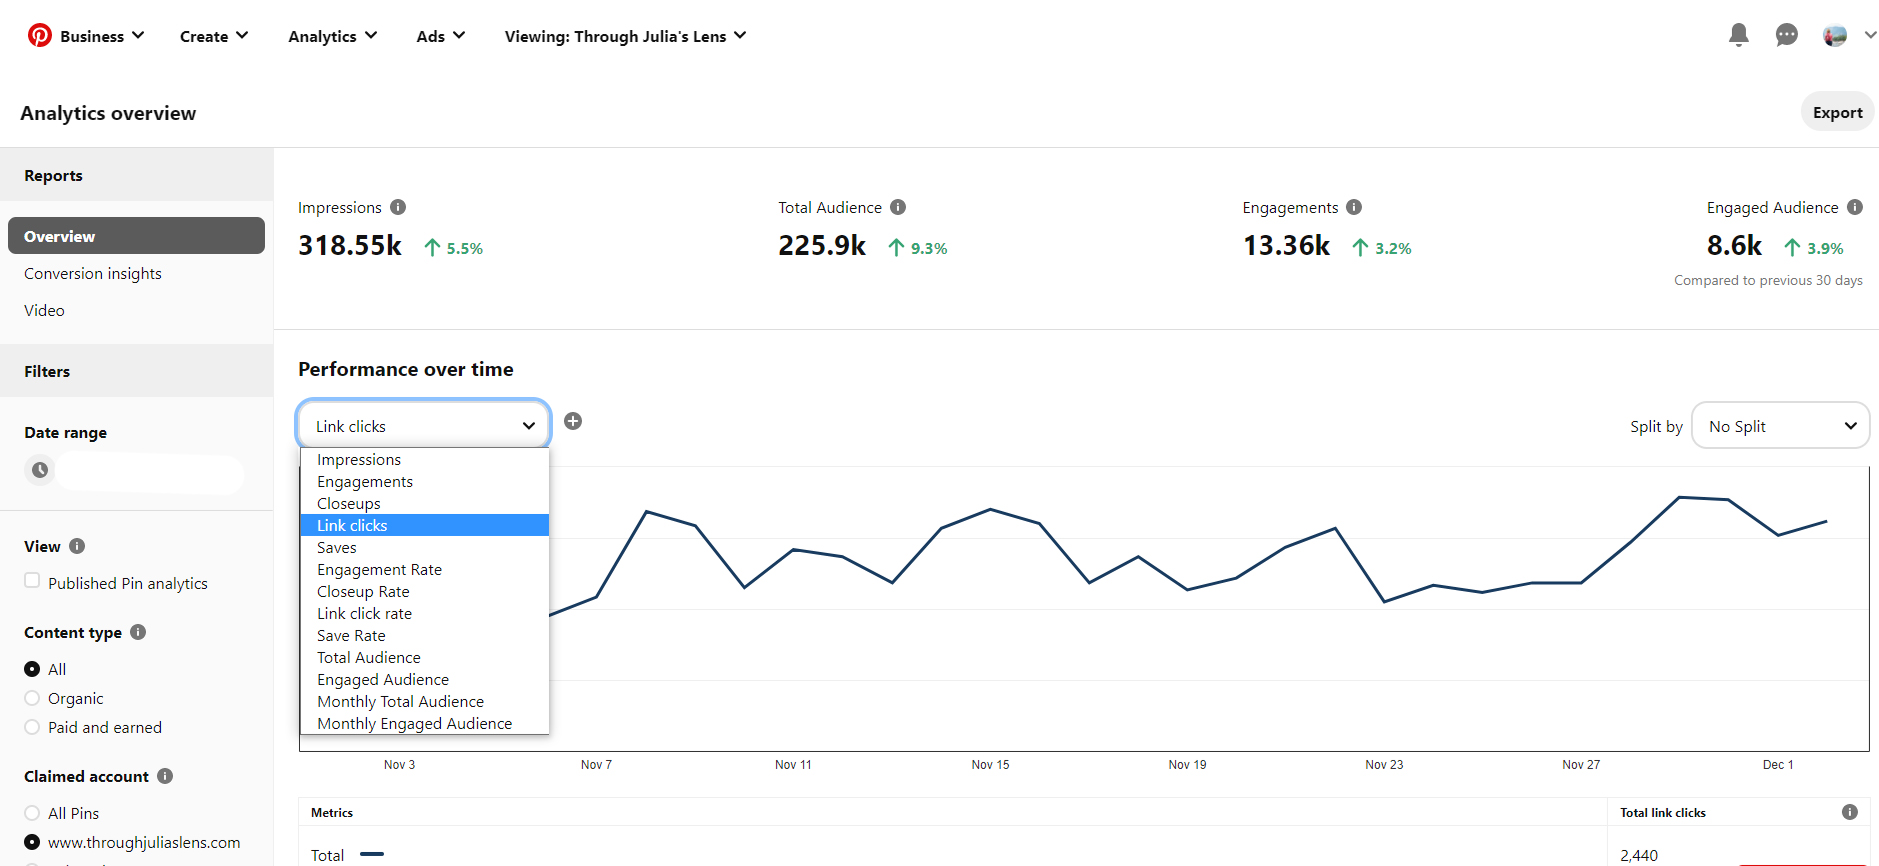
I don’t recommend looking at Impressions because it can just be an inflated vanity metric. You want to make sure your pins are getting reshared and driving traffic to your site, so that’s why I recommend focusing on your engagement.
Pinterest is a slow burn, so don’t worry if you’re seeing gradual growth! People typically grow 1-5% per month on Pinterest, so it takes time to gain traction and see sustainable growth.
Below the graph of traffic, you’ll see your top performing pins. Again, I recommend sorting by metrics related to engagement.
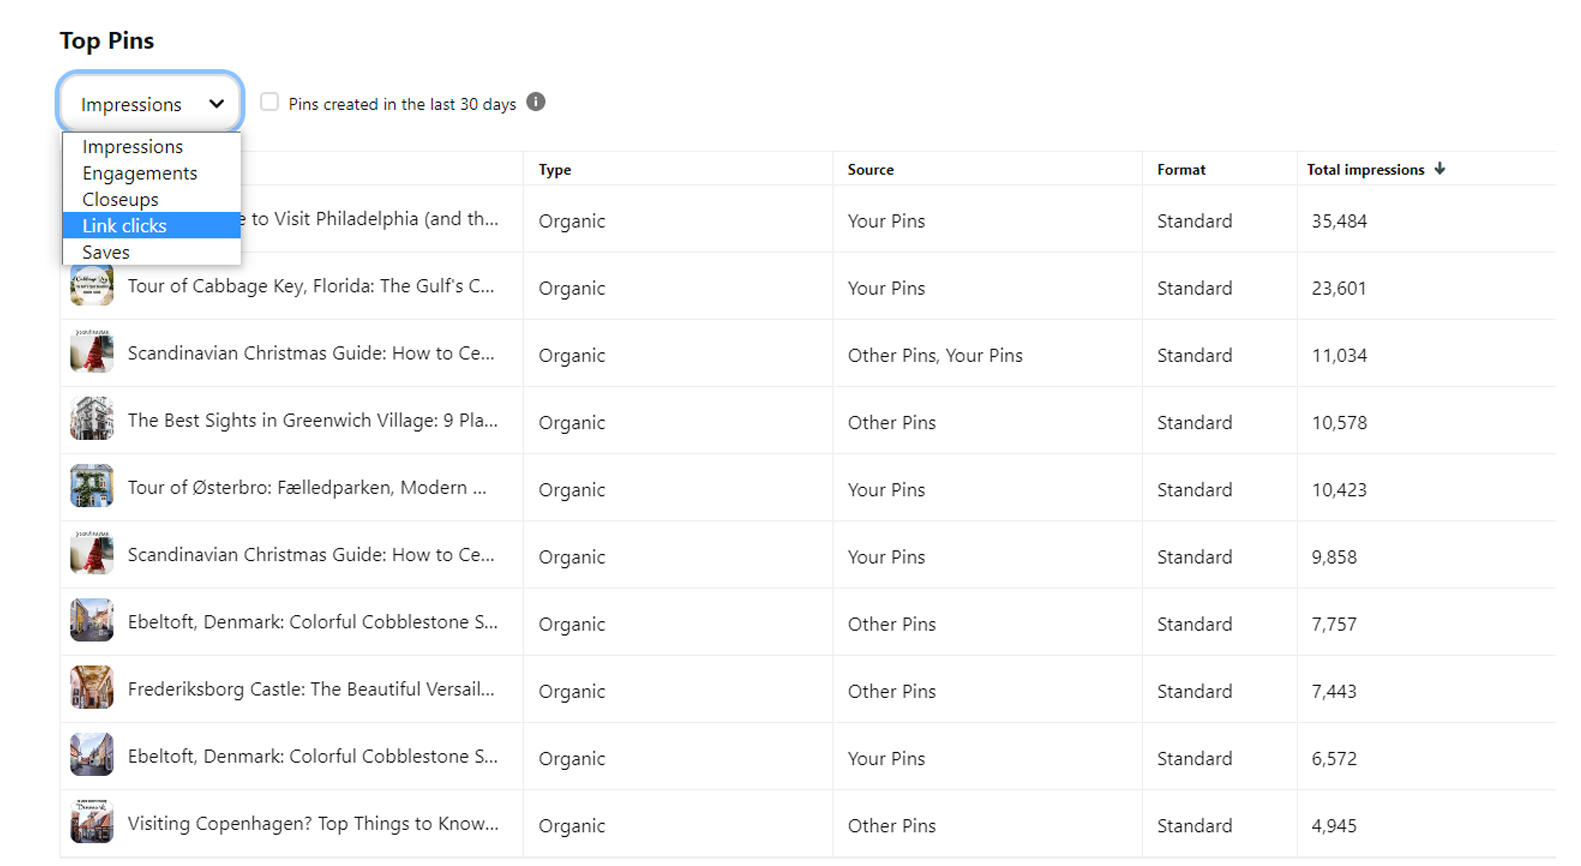
The Type is organic or paid, if you’re running ads. Source means who pinned it, so if it’s your pin that someone else pinned or saved, you’ll see Other Pins. Format is the type of pin if you’re doing something like video or story pins.
If you’re testing different designs or keywords, this is where you can compare them to see what’s performing best. This is also where I like to give my clients ideas for topics to write about (and you can also use Pinterest Trends for ideas). For example, I work with a freelance writer and her content about pitching articles and how to pitch are performing really well right now, so I recommended that she writes more posts on pitching topics since they’re performing the best on Pinterest.
Bonus- check Google Analytics
Pinterest Analytics will show you traffic from your pins, and Google Analytics will give you information on what your Pinterest visitors do once they’re on your site!
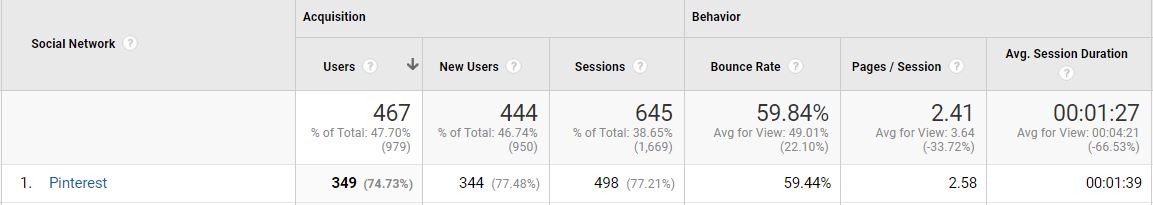
To get here, go to Acquisition-Overview, and on the graph, click on Social to get a breakdown of your social media traffic (some Pinterest traffic can be under Direct or Referral sometimes, so check there if there’s a big difference between Pinterest and Google Analytics).
In Google Analytics, you’ll want to look at your Bounce Rate, Pages/Session, and Average Session Duration, and you can compare it to the data from your other social media channels. Having a low Bounce Rate and high Pages/Session and Average Session Duration means that once people are on your site, they’re sticking around for a bit and checking out multiple pages, which is what you want to aim for!
If you’re finding that people coming from Pinterest aren’t staying on your site long, you’ll want to check out your content and see why. Are your blog posts really short? Do you not have a clear call-to-action to guide people around your site? Is your blog post visually appealing, or do you just have big chunks of text? Does the content match what you promised in your pin?
If it’s hard for you to analyze your own content, ask a business friend for help!

What Pinterest Analytics data means
That’s a lot of data to check, so what does it mean for your business?
Overall, you want to make sure that your Pinterest account is increasing in traffic every month (you may see seasonal dips, especially around the holidays, so just monitor that). You can also use the data in Pinterest Analytics to see what topics people are most interested, which types of designs perform the best, which keywords perform the best, which types of pins people are most interested in saving, and more. If you’re running ads or testing video pins, track your data to see if what you’re doing is working. And if it isn’t, you can test out a new strategy, design, or keyword.
Have questions about what’s going on in your Pinterest Analytics or struggling with how to use Pinterest Analytics for your business? Comment below with your questions!


